354615
Figure shown is a graph, at a certain time \(t\), of the displacement function \(S(x, t)\) of three sound waves 1, 2 and 3 as marked on the curves having same displacement amplitudes that travel along \(x\)-axis through air. If \(P_{1}, P_{2}\) and \(P_{3}\) represent their pressure amplitudes respectively, then correct relation between them is :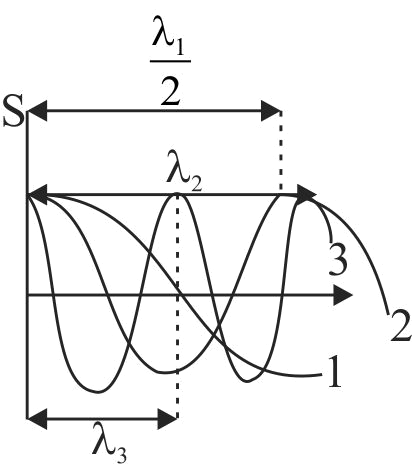