Explanation:
For an adiabatic process, constant,
Differentiating, we have
or
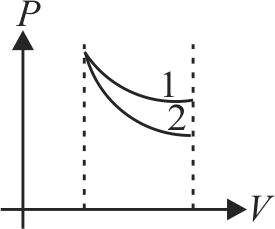
Thus, the slope of curve is proportional to . Now, for a diatomic gas, is less then that for a monoatomic gas for which . Therefore, the slope of the curve is less for a diatomic gas than for a monoatomic gas. Hence curve 1 corresponds to diatomic gas ans curve 2 to monoatomic gas. Thus the correct choice is (2).