365430
Solar spectrum is shown in the figure. Here \(h\) is planck’s constant and \(v\) is frequency. The band gaps for the solar cells \(A\), \(B\), \(C\) and \(D\) are 0.8 \(eV\), 1.2\(eV\), 3.0 \(eV\), & 1.5 \(e\)V respectively. Predict which cell is more effective as a solar cell.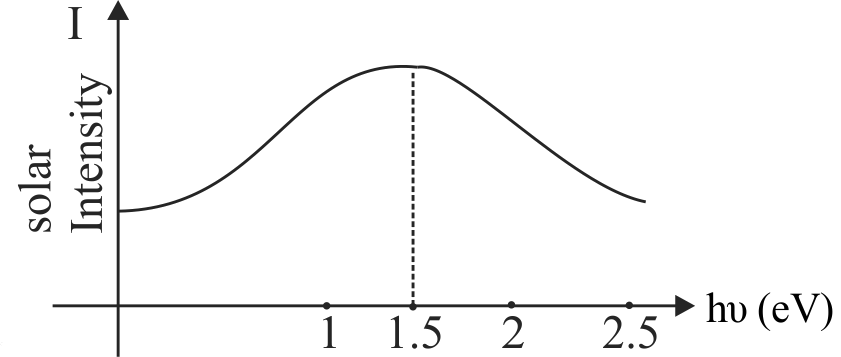
365430
Solar spectrum is shown in the figure. Here \(h\) is planck’s constant and \(v\) is frequency. The band gaps for the solar cells \(A\), \(B\), \(C\) and \(D\) are 0.8 \(eV\), 1.2\(eV\), 3.0 \(eV\), & 1.5 \(e\)V respectively. Predict which cell is more effective as a solar cell.
365430
Solar spectrum is shown in the figure. Here \(h\) is planck’s constant and \(v\) is frequency. The band gaps for the solar cells \(A\), \(B\), \(C\) and \(D\) are 0.8 \(eV\), 1.2\(eV\), 3.0 \(eV\), & 1.5 \(e\)V respectively. Predict which cell is more effective as a solar cell.
365430
Solar spectrum is shown in the figure. Here \(h\) is planck’s constant and \(v\) is frequency. The band gaps for the solar cells \(A\), \(B\), \(C\) and \(D\) are 0.8 \(eV\), 1.2\(eV\), 3.0 \(eV\), & 1.5 \(e\)V respectively. Predict which cell is more effective as a solar cell.
365430
Solar spectrum is shown in the figure. Here \(h\) is planck’s constant and \(v\) is frequency. The band gaps for the solar cells \(A\), \(B\), \(C\) and \(D\) are 0.8 \(eV\), 1.2\(eV\), 3.0 \(eV\), & 1.5 \(e\)V respectively. Predict which cell is more effective as a solar cell.