345005
In the species-area relationship, ' \(Z\) ' represents
1 Regression coefficient
2 Species coefficient
3 Speices richness
4 None of the above
Explanation:
\(\mathrm{Z}\) represents regression coefficient.
BIOXII15: BIODIVERSITY AND CONSERVATION
345006
Alexander Von Humbolt described for the first time:
1 Laws of limiting factor
2 Species area relationships
3 Population Growth equation
4 Ecological Biodiversity
Explanation:
German naturalist and geographer Alexander Von Humboldt has observed that within a region, species richness gets increased when explored area is increased, but only up to a limit. He was first to work on species -area relationship
BIOXII15: BIODIVERSITY AND CONSERVATION
345007
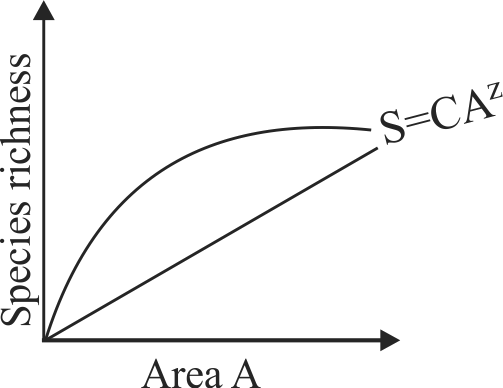
The given graph represents
1 Population growth
2 Enzyme activity
3 Species area relationship
4 Growth of organisms
Explanation:
Graphical representation indicating species area relationship proposed by Alexander Von Humboldt.
KCET - 2022
BIOXII15: BIODIVERSITY AND CONSERVATION
345008
Which one is incorect w.r.t to equation for \(\mathrm{S}=\mathrm{CA}\) Sps.- area relationship explained by Von Humboldt.
1 \(\mathrm{S}=\) Sps. richness
2 \(\mathrm{S}=\) Slope of line
3 \(Z=\) regression coefficient
4 \(\mathrm{e}=\mathrm{Y}\) - intercept
Explanation:
\(\mathrm{S}\) represents species richness in species-area relationship.
345005
In the species-area relationship, ' \(Z\) ' represents
1 Regression coefficient
2 Species coefficient
3 Speices richness
4 None of the above
Explanation:
\(\mathrm{Z}\) represents regression coefficient.
BIOXII15: BIODIVERSITY AND CONSERVATION
345006
Alexander Von Humbolt described for the first time:
1 Laws of limiting factor
2 Species area relationships
3 Population Growth equation
4 Ecological Biodiversity
Explanation:
German naturalist and geographer Alexander Von Humboldt has observed that within a region, species richness gets increased when explored area is increased, but only up to a limit. He was first to work on species -area relationship
BIOXII15: BIODIVERSITY AND CONSERVATION
345007
The given graph represents
1 Population growth
2 Enzyme activity
3 Species area relationship
4 Growth of organisms
Explanation:
Graphical representation indicating species area relationship proposed by Alexander Von Humboldt.
KCET - 2022
BIOXII15: BIODIVERSITY AND CONSERVATION
345008
Which one is incorect w.r.t to equation for \(\mathrm{S}=\mathrm{CA}\) Sps.- area relationship explained by Von Humboldt.
1 \(\mathrm{S}=\) Sps. richness
2 \(\mathrm{S}=\) Slope of line
3 \(Z=\) regression coefficient
4 \(\mathrm{e}=\mathrm{Y}\) - intercept
Explanation:
\(\mathrm{S}\) represents species richness in species-area relationship.
NEET Test Series from KOTA - 10 Papers In MS WORD
WhatsApp Here
BIOXII15: BIODIVERSITY AND CONSERVATION
345005
In the species-area relationship, ' \(Z\) ' represents
1 Regression coefficient
2 Species coefficient
3 Speices richness
4 None of the above
Explanation:
\(\mathrm{Z}\) represents regression coefficient.
BIOXII15: BIODIVERSITY AND CONSERVATION
345006
Alexander Von Humbolt described for the first time:
1 Laws of limiting factor
2 Species area relationships
3 Population Growth equation
4 Ecological Biodiversity
Explanation:
German naturalist and geographer Alexander Von Humboldt has observed that within a region, species richness gets increased when explored area is increased, but only up to a limit. He was first to work on species -area relationship
BIOXII15: BIODIVERSITY AND CONSERVATION
345007
The given graph represents
1 Population growth
2 Enzyme activity
3 Species area relationship
4 Growth of organisms
Explanation:
Graphical representation indicating species area relationship proposed by Alexander Von Humboldt.
KCET - 2022
BIOXII15: BIODIVERSITY AND CONSERVATION
345008
Which one is incorect w.r.t to equation for \(\mathrm{S}=\mathrm{CA}\) Sps.- area relationship explained by Von Humboldt.
1 \(\mathrm{S}=\) Sps. richness
2 \(\mathrm{S}=\) Slope of line
3 \(Z=\) regression coefficient
4 \(\mathrm{e}=\mathrm{Y}\) - intercept
Explanation:
\(\mathrm{S}\) represents species richness in species-area relationship.