320235
Figure shows a graph in \(\log _{10} \mathrm{k}\) vs \(\dfrac{1}{\mathrm{~T}}\) where \(\mathrm{k}\) is rate constant and \(\mathrm{T}\) is temperature. The straight line \(\mathrm{BC}\) has slope, \(\tan \theta=-\dfrac{1}{2.303}\) and an intercept of 5 on \({\text{y - axis}}\). Thus \(E_{a}\), the energy of activation is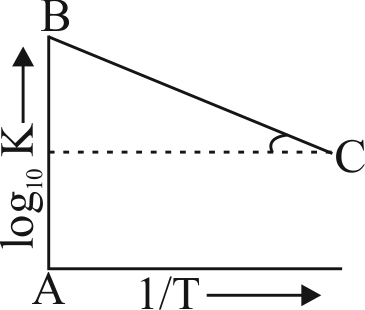