356092
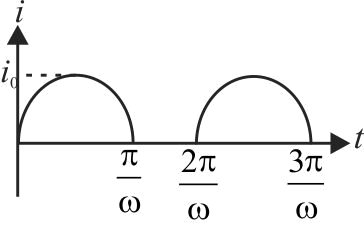
The average and effective values for the wave shape shown in the figure are:
1 \(\dfrac{2}{\pi} V_{m}\) and \(\dfrac{V_{m}}{2}\)
2 \(\dfrac{V_{m}}{\pi}\) and \(\dfrac{V_{m}}{\sqrt{2}}\)
3 \(\dfrac{2}{\pi} V_{m}\) and \(\dfrac{V_{m}}{\sqrt{2}}\)
4 \(\dfrac{V_{m}}{\pi \sqrt{2}}\) and \(\dfrac{V_{m}}{\sqrt{2}}\)
Explanation:
The equation of the graph from 0 to \(\pi\) is \(V=V_{m} \sin \theta\) The average value is \({V_{avg{\rm{ }}}} = \frac{{\int_0^\pi V d\theta }}{\pi }\) \(\begin{aligned}& V_{\text {avg }}=\dfrac{V_{m}}{\pi} \int_{0}^{\pi} \sin \theta d \theta=\dfrac{2 V_{m}}{\pi} \\& V_{\text {eff }}^{2}=\dfrac{V_{m}^{2}}{\pi} \int_{0}^{\pi} \sin ^{2} \theta d \theta=\dfrac{V_{m}^{2}}{2} \\& V_{\text {eff }}=V_{m} / \sqrt{2}\end{aligned}\)
356092
The average and effective values for the wave shape shown in the figure are:
1 \(\dfrac{2}{\pi} V_{m}\) and \(\dfrac{V_{m}}{2}\)
2 \(\dfrac{V_{m}}{\pi}\) and \(\dfrac{V_{m}}{\sqrt{2}}\)
3 \(\dfrac{2}{\pi} V_{m}\) and \(\dfrac{V_{m}}{\sqrt{2}}\)
4 \(\dfrac{V_{m}}{\pi \sqrt{2}}\) and \(\dfrac{V_{m}}{\sqrt{2}}\)
Explanation:
The equation of the graph from 0 to \(\pi\) is \(V=V_{m} \sin \theta\) The average value is \({V_{avg{\rm{ }}}} = \frac{{\int_0^\pi V d\theta }}{\pi }\) \(\begin{aligned}& V_{\text {avg }}=\dfrac{V_{m}}{\pi} \int_{0}^{\pi} \sin \theta d \theta=\dfrac{2 V_{m}}{\pi} \\& V_{\text {eff }}^{2}=\dfrac{V_{m}^{2}}{\pi} \int_{0}^{\pi} \sin ^{2} \theta d \theta=\dfrac{V_{m}^{2}}{2} \\& V_{\text {eff }}=V_{m} / \sqrt{2}\end{aligned}\)