339354
\({\rm{P}}\)' wave of ECG occurs just before the
1 onset of ventricular contraction.
2 end of atrial contraction.
3 beginning of atrial contraction.
4 none of the above.
Explanation:
The P-wave indicates atrial depolarization, which causes atrial systole. During this wave, the impulse of contraction is generated by the SA node.
BIOXI18: BODY FLUIDS AND CIRCULATION
339355
Electrocardiogram is a
1 Artificial heart
2 Process
3 Machine
4 Graph
Explanation:
The machine (electro-cardiograph) is used to obtain an electrocardiogram (ECG) (graph).
BIOXI18: BODY FLUIDS AND CIRCULATION
339356
ECG depicts the depolarisation and repolarisation processes during the cardiac cycle. In the ECG of a normal healthy individual one of the following waves is not represented.
1 Depolarisation of atria
2 Repolarisation of atria
3 Depolarisation of ventricles
4 Repolarisation of ventricles
Explanation:
\(\mathrm{P}\) wave shows depolarisation of atria. QRS complex shows depolarisation of ventricles \(T\) wave shows repolarisation of ventricles.
NCERT Exemplar
BIOXI18: BODY FLUIDS AND CIRCULATION
339357
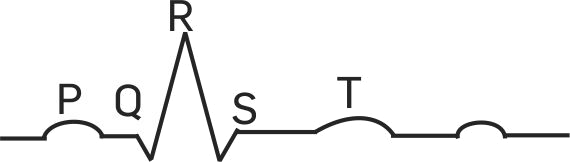
The given figure represents diagrammatic presentation of an ECG. Each peak in the ECG is identified with a letter from \(\mathrm{P}\) to \(\mathrm{T}\) that corresponds to a specific electrical activity of the heart.
1 QRS - Depolarization of the ventricles
2 R wave - Marks the end of the systole.
3 P-Electrical excitation (or depolarization) of the atria
4 T wave - Return of the ventricles from excited to normal state (repolarization).
NEET Test Series from KOTA - 10 Papers In MS WORD
WhatsApp Here
BIOXI18: BODY FLUIDS AND CIRCULATION
339354
\({\rm{P}}\)' wave of ECG occurs just before the
1 onset of ventricular contraction.
2 end of atrial contraction.
3 beginning of atrial contraction.
4 none of the above.
Explanation:
The P-wave indicates atrial depolarization, which causes atrial systole. During this wave, the impulse of contraction is generated by the SA node.
BIOXI18: BODY FLUIDS AND CIRCULATION
339355
Electrocardiogram is a
1 Artificial heart
2 Process
3 Machine
4 Graph
Explanation:
The machine (electro-cardiograph) is used to obtain an electrocardiogram (ECG) (graph).
BIOXI18: BODY FLUIDS AND CIRCULATION
339356
ECG depicts the depolarisation and repolarisation processes during the cardiac cycle. In the ECG of a normal healthy individual one of the following waves is not represented.
1 Depolarisation of atria
2 Repolarisation of atria
3 Depolarisation of ventricles
4 Repolarisation of ventricles
Explanation:
\(\mathrm{P}\) wave shows depolarisation of atria. QRS complex shows depolarisation of ventricles \(T\) wave shows repolarisation of ventricles.
NCERT Exemplar
BIOXI18: BODY FLUIDS AND CIRCULATION
339357
The given figure represents diagrammatic presentation of an ECG. Each peak in the ECG is identified with a letter from \(\mathrm{P}\) to \(\mathrm{T}\) that corresponds to a specific electrical activity of the heart.
1 QRS - Depolarization of the ventricles
2 R wave - Marks the end of the systole.
3 P-Electrical excitation (or depolarization) of the atria
4 T wave - Return of the ventricles from excited to normal state (repolarization).