338967
In the oxygen - haemoglobin dissociation curve given below, the shift from curve A to B could be caused by
i. Fall in pH
ii. Increase in carbon dioxide level in blood
iii. Rise in pH
iv. Fall in carbon dioxide level in blood
v. Rise in temperature
vi. Fall in temperature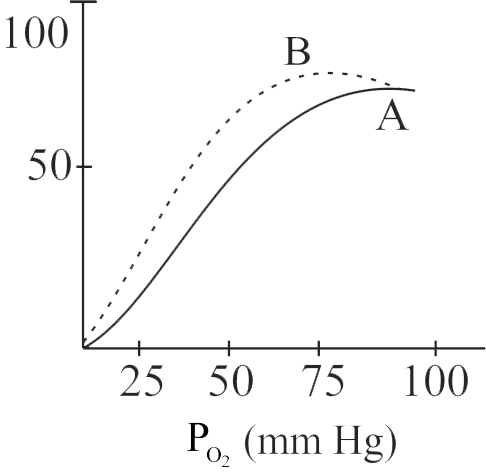
338967
In the oxygen - haemoglobin dissociation curve given below, the shift from curve A to B could be caused by
i. Fall in pH
ii. Increase in carbon dioxide level in blood
iii. Rise in pH
iv. Fall in carbon dioxide level in blood
v. Rise in temperature
vi. Fall in temperature
338967
In the oxygen - haemoglobin dissociation curve given below, the shift from curve A to B could be caused by
i. Fall in pH
ii. Increase in carbon dioxide level in blood
iii. Rise in pH
iv. Fall in carbon dioxide level in blood
v. Rise in temperature
vi. Fall in temperature

338967
In the oxygen - haemoglobin dissociation curve given below, the shift from curve A to B could be caused by
i. Fall in pH
ii. Increase in carbon dioxide level in blood
iii. Rise in pH
iv. Fall in carbon dioxide level in blood
v. Rise in temperature
vi. Fall in temperature
338967
In the oxygen - haemoglobin dissociation curve given below, the shift from curve A to B could be caused by
i. Fall in pH
ii. Increase in carbon dioxide level in blood
iii. Rise in pH
iv. Fall in carbon dioxide level in blood
v. Rise in temperature
vi. Fall in temperature