356569
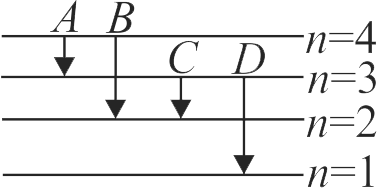
The energy levels of an hydrogen atom are shown below. The transition corresponding to emission of shortest wavelength is
1 \(D\)
2 \(B\)
3 \(C\)
4 \(A\)
Explanation:
We know wavelength of emitted photon is given by \(\lambda=\dfrac{h c}{\Delta E}\), where \(\Delta E\) is the energy difference between two stable energy levels. From the given energy levels we can say that transition \(D\), corresponds to emission of shortest wavelength because shortest wavelength corresponds to highest energy difference (de-excitation) which will occur in \(D\), as \(n=3\) to \(n=1\). So correct option is (1).
JEE - 2023
PHXII12:ATOMS
356570
The frequencies for series limit of Balmer and Paschen series respectively are \('{v_1}'\) and \('{v_3}'\). If frequency of first line of Balmer series is then the relation between \('{v_1}','{v_2}'\) and \('{v_3}'\) is
356571
The spectral series of the hydrogen spectrum that lies in the ultraviolet region is the
1 P fund series
2 Balmer series
3 Lyman series
4 Paschen series
Explanation:
Lyman series lies in the \(UV\) region.
PHXII12:ATOMS
356572
Spectrum of sunlight is an example for
1 Band emission spectrum
2 Line absorption spectrum
3 Continuous emission spectrum
4 Continuous absorption spectrum
Explanation:
The spectrum of sunlight, when passed through a prism or diffraction grating, shows a continuous spectrum of colors with dark lines superimposed on it. These dark lines, known as absorption lines or Fraunhofer lines, are due to the absorption of specific wavelengths of light by elements present in the Sun's outer layers. These elements absorb light at specific wavelengths, creating dark lines in the otherwise continuous spectrum. This phenomenon is known as a line absorption spectrum.
356569
The energy levels of an hydrogen atom are shown below. The transition corresponding to emission of shortest wavelength is
1 \(D\)
2 \(B\)
3 \(C\)
4 \(A\)
Explanation:
We know wavelength of emitted photon is given by \(\lambda=\dfrac{h c}{\Delta E}\), where \(\Delta E\) is the energy difference between two stable energy levels. From the given energy levels we can say that transition \(D\), corresponds to emission of shortest wavelength because shortest wavelength corresponds to highest energy difference (de-excitation) which will occur in \(D\), as \(n=3\) to \(n=1\). So correct option is (1).
JEE - 2023
PHXII12:ATOMS
356570
The frequencies for series limit of Balmer and Paschen series respectively are \('{v_1}'\) and \('{v_3}'\). If frequency of first line of Balmer series is then the relation between \('{v_1}','{v_2}'\) and \('{v_3}'\) is
356571
The spectral series of the hydrogen spectrum that lies in the ultraviolet region is the
1 P fund series
2 Balmer series
3 Lyman series
4 Paschen series
Explanation:
Lyman series lies in the \(UV\) region.
PHXII12:ATOMS
356572
Spectrum of sunlight is an example for
1 Band emission spectrum
2 Line absorption spectrum
3 Continuous emission spectrum
4 Continuous absorption spectrum
Explanation:
The spectrum of sunlight, when passed through a prism or diffraction grating, shows a continuous spectrum of colors with dark lines superimposed on it. These dark lines, known as absorption lines or Fraunhofer lines, are due to the absorption of specific wavelengths of light by elements present in the Sun's outer layers. These elements absorb light at specific wavelengths, creating dark lines in the otherwise continuous spectrum. This phenomenon is known as a line absorption spectrum.
NEET Test Series from KOTA - 10 Papers In MS WORD
WhatsApp Here
PHXII12:ATOMS
356569
The energy levels of an hydrogen atom are shown below. The transition corresponding to emission of shortest wavelength is
1 \(D\)
2 \(B\)
3 \(C\)
4 \(A\)
Explanation:
We know wavelength of emitted photon is given by \(\lambda=\dfrac{h c}{\Delta E}\), where \(\Delta E\) is the energy difference between two stable energy levels. From the given energy levels we can say that transition \(D\), corresponds to emission of shortest wavelength because shortest wavelength corresponds to highest energy difference (de-excitation) which will occur in \(D\), as \(n=3\) to \(n=1\). So correct option is (1).
JEE - 2023
PHXII12:ATOMS
356570
The frequencies for series limit of Balmer and Paschen series respectively are \('{v_1}'\) and \('{v_3}'\). If frequency of first line of Balmer series is then the relation between \('{v_1}','{v_2}'\) and \('{v_3}'\) is
356571
The spectral series of the hydrogen spectrum that lies in the ultraviolet region is the
1 P fund series
2 Balmer series
3 Lyman series
4 Paschen series
Explanation:
Lyman series lies in the \(UV\) region.
PHXII12:ATOMS
356572
Spectrum of sunlight is an example for
1 Band emission spectrum
2 Line absorption spectrum
3 Continuous emission spectrum
4 Continuous absorption spectrum
Explanation:
The spectrum of sunlight, when passed through a prism or diffraction grating, shows a continuous spectrum of colors with dark lines superimposed on it. These dark lines, known as absorption lines or Fraunhofer lines, are due to the absorption of specific wavelengths of light by elements present in the Sun's outer layers. These elements absorb light at specific wavelengths, creating dark lines in the otherwise continuous spectrum. This phenomenon is known as a line absorption spectrum.